Scoring Creative Fatigue on Meta Ads
From Weekly Audits to a Daily Score
At seven figures of monthly Meta spend across multiple DTC brands, creative fatigue is one of the fastest ways to quietly waste budget. Ads degrade over time and, if nobody catches it early, the money keeps flowing into creatives that stopped working days ago.
The team was doing weekly creative audits, which don't scale well across a growing number of brands and channels. So I wanted to build a system to catch issues faster.
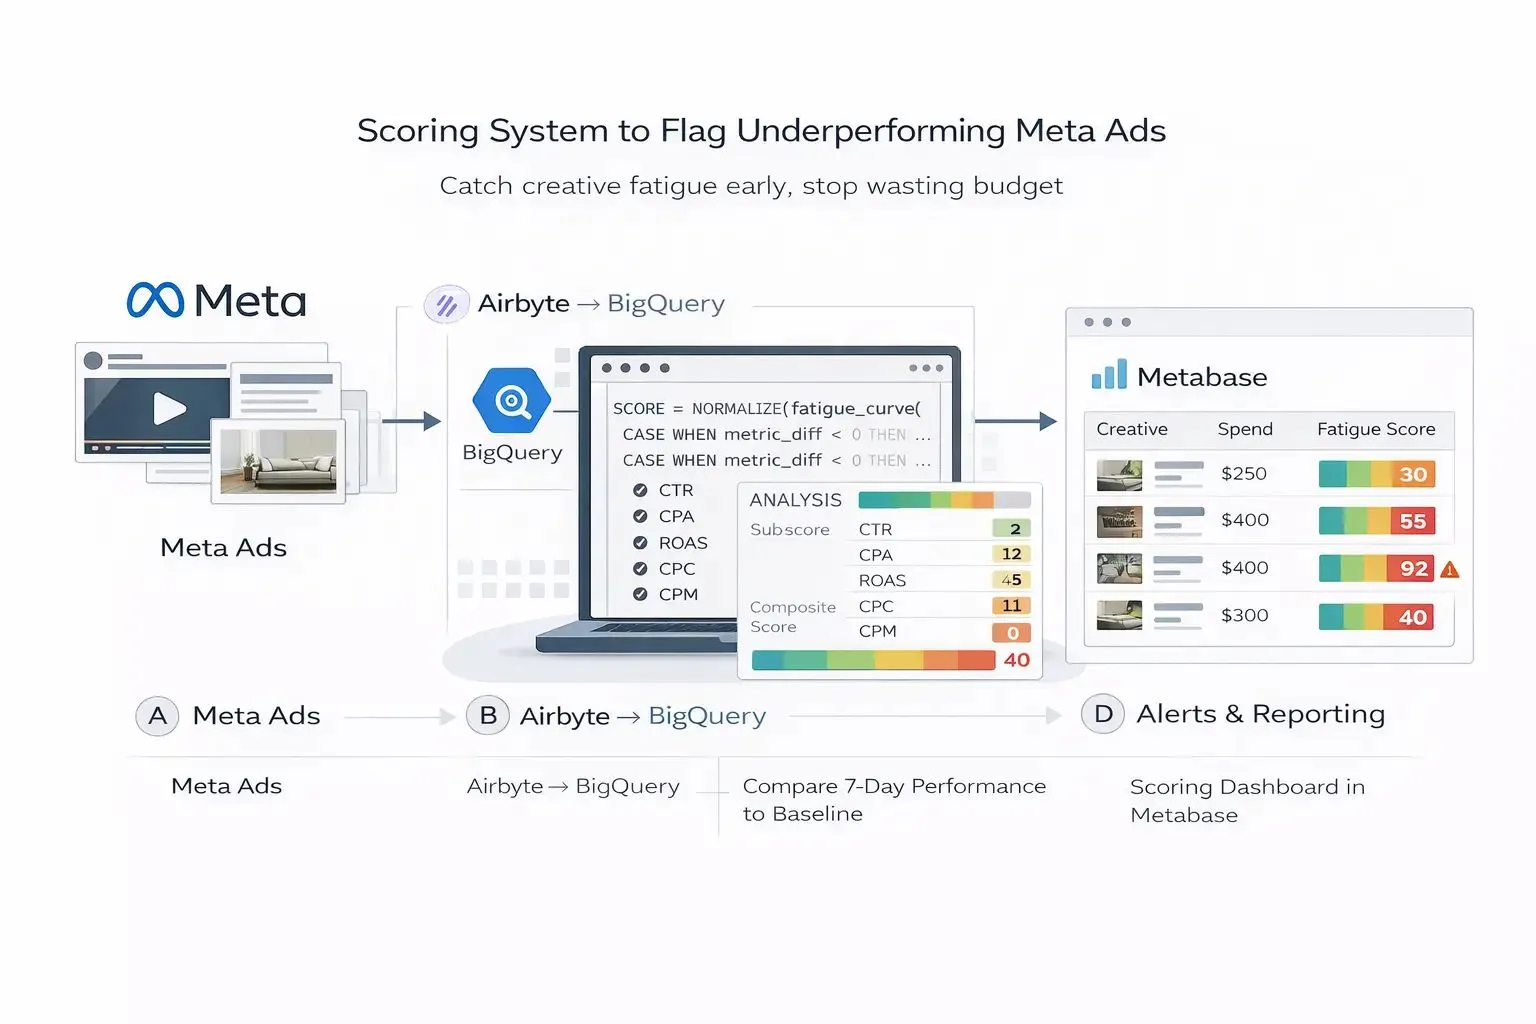
I built is a scored table in BigQuery, sitting on top of the Meta Ads pipeline from the modern data stack I'd built for them earlier — Airbyte into the warehouse, Metabase on top. Two SQL files: a build script that materializes the scores every morning after the sync, and a thin read query the dashboard points at.
What gets scored
Fatigue is a property of the creative, not of the ad, so that's the level I score at. One asset running across six ads is one fatigue problem, not six, and scoring it six times would let a single tired video take over the whole top of the dashboard. Everything gets aggregated up to the creative across the trailing 90 days.
CTR, CPC, CPA and frequency for everything. Conversions are the sum of pixel purchase and pixel lead out of the actions array.
For video I added three engagement metrics, picked around the fact that our videos are mostly 30 seconds or longer:
| Metric | Definition | Signal |
|---|---|---|
| Hook rate | 'video_p25_watched_actions' ÷ impressions | Scroll-stopping power |
| Hold rate | 'video_p75_watched_actions' ÷ 'video_p25_watched_actions' | Mid-video retention |
| ThruPlay rate | 'video_view' ÷ impressions | 15s completion |
I left completion rate out on purpose. At that length, full completion isn't a realistic expectation, and I didn't want a metric nobody should be optimizing toward sitting inside a score that tells people to pause things.
Comparing windows
Every metric gets measured over two windows. Baseline is days 3 through 10 after the creative first went live, which skips the learning period. Recent is the trailing 7 days. Decay is the percentage change between the two, signed so that positive always means things got worse.
Each decay percentage maps onto a 0–100 sub-score through a piecewise linear curve, breaking at 10%, 25% and 50%. Frequency is the exception — it uses absolute thresholds at 1.5, 2.5, 4.0 and 6.0, since frequency doesn't really decay, it accumulates.
The composite weighting branches depending on what the creative is and what data exists for it:
| Case | Weights |
|---|---|
| Video, engagement + conversions | Hook 0.20, Hold 0.15, ThruPlay 0.05, CTR 0.10, CPA 0.25, CPC 0.10, Freq 0.10 |
| Video, engagement, no conversions | Hook 0.25, Hold 0.20, ThruPlay 0.10, CTR 0.20, CPC 0.15, Freq 0.10 |
| Image, conversions | CTR 0.40, CPA 0.35, CPC 0.15, Freq 0.10 |
| Image, no conversions | CTR 0.55, CPC 0.30, Freq 0.15 |
There are a couple of guards on top. Nothing gets scored without at least 1,000 lifetime impressions, 7 days live, and spend in the last 7 days. And if recent frequency is under 2.0 the score caps at 30 — a creative that has barely been served to the same person twice isn't fatigued, whatever its CTR curve is doing. That one came from looking at early output and not believing some of the scores.
What the table outputs
The scored table keeps baseline and recent values for every metric, the decay percentages, all seven sub-scores and the composite. On top of that it exposes the parts someone actually acts on:
- A four-band status — healthy, early fatigue, fatigued, severe fatigue
- A recommended action per band, from no action needed through to pause and replace immediately
- A video diagnosis that reads the hook and hold sub-scores and says whether the problem is the opening, the middle and end, or the whole thing
It's partitioned by first live date and clustered by status, brand and media type. The Metabase query does no computation at all, just a select, so the dashboard costs basically nothing to run.
The sorting is the part I went back and forth on. It ranks by fatigue score multiplied by trailing 7-day spend rather than by score alone, because the most decayed creative in the account is often one running on forty dollars a day. What the team needs at the top of the list is where fatigue is costing real money.
What it changes
The score doesn't decide anything. A buyer still opens the creative and works out whether it needs a new hook, a re-edit, or just to be cut. What the table does is make sure that conversation starts on the right creative, every morning, instead of on whichever account happened to come up in the audit that week.
The weights are the part I expect to move. Right now they encode my read of what matters — hook and hold carrying most of the video score, CPA carrying most of the conversion side. Once there's enough history of creatives that got paused and what happened to the account afterwards, that judgment can be checked against outcomes and adjusted, which is a better position to tune from than the one I started in.